Reporting with Grafana
INFO
This guide is about Grafana. If you want to use another tool, check if it supports Elasticsearch indexes. If yes, then you are good to go!
Grafana is a third party analytics/visualization application you can connect to Zammad (precisely: Elasticsearch). It can access the Elasticsearch index and visualize your Zammad data.
This guide will provide you some steps to get started. For a deeper insight you should consider having a look at Elasticsearch's indexed attributes and to read the documentation of Grafana.
This guide expects all requirements to be up and running. We will not cover core configurations of each tool. Please also note that we can't support you with configuration of your specific third party tool.
Prerequisites
You need:
- A running instance of Grafana (hosted or self-hosted) in version 10.3 or higher
- Read access to your Elasticsearch index
- A Zammad instance in version 4 or higher
WARNING
Never expose Elasticsearch to the public if you're not sure how to do it. Especially never without authentication! Zammad stores very sensitive information within the Elasticsearch Index.
Setting up Required Data Sources
Before we start: The data sources always follow the same scheme. We reduced below information to name, time field name and index name. Everything else relies on your environment and is out of our scope.
TIP
Replace zammad_production_ with your fitting prefix.
Click on details to see how to query the index.
Details
Adjust the following command to your environment:
curl http://localhost:9200/_aliases?pretty=trueThis will return an output like the following:
{
  "zammad_production_knowledge_base_translation" : {
    "aliases" : { }
  },
  "zammad_production_ticket_priority" : {
    "aliases" : { }
  },
  "zammad_production_stats_store" : {
    "aliases" : { }
  },
  "zammad_production_organization" : {
    "aliases" : { }
  },
  "zammad_production_cti_log" : {
    "aliases" : { }
  },
  "zammad_production_group" : {
    "aliases" : { }
  },
  "zammad_production_knowledge_base_answer_translation" : {
    "aliases" : { }
  },
  "zammad_production_ticket" : {
    "aliases" : { }
  },
  "zammad_production_ticket_state" : {
    "aliases" : { }
  },
  "zammad_production_chat_session" : {
    "aliases" : { }
  },
  "zammad_production_user" : {
    "aliases" : { }
  },
  "zammad_production_knowledge_base_category_translation" : {
    "aliases" : { }
  }
}
ES - Chat Sessions
- Index name:
zammad_production_chat_session - Time field name:
created_at
ES - CTI Log
- Index name:
zammad_production_cti_log - Time field name:
start_at
ES - Ticket Articles
- Index name:
zammad_production_ticket - Time field name:
article.created_at
ES - Tickets by closed_at
- Index name:
zammad_production_ticket - Time field name:
close_at
ES - Tickets by created_at
- Index name:
zammad_production_ticket - Time field name:
created_at
ES - Tickets by first_response_at
- Index name:
zammad_production_ticket - Time field name:
first_response_at
With above data sources you basically have everything you need to start building your own dashboards.
Quick Start with Dashboard Template
If you want to get inspired, you can use our sample dashboards as mentioned below. These dashboards can also be found on GitHub.
Importing a Dashboard
In Grafana, select ➕ > Import (or any other place which offers you to import a dashboard) and either upload the json file you downloaded from Github or use the grafana.com ID, provided as badge like 12345 attached to the next sections titles.
During importing you can provide a dashboard name and folder. You'll also be asked to map the data sources to your environment. If you used our data source names above, you can simply search for the same name.
Ticket Statistics Dashboard 14222
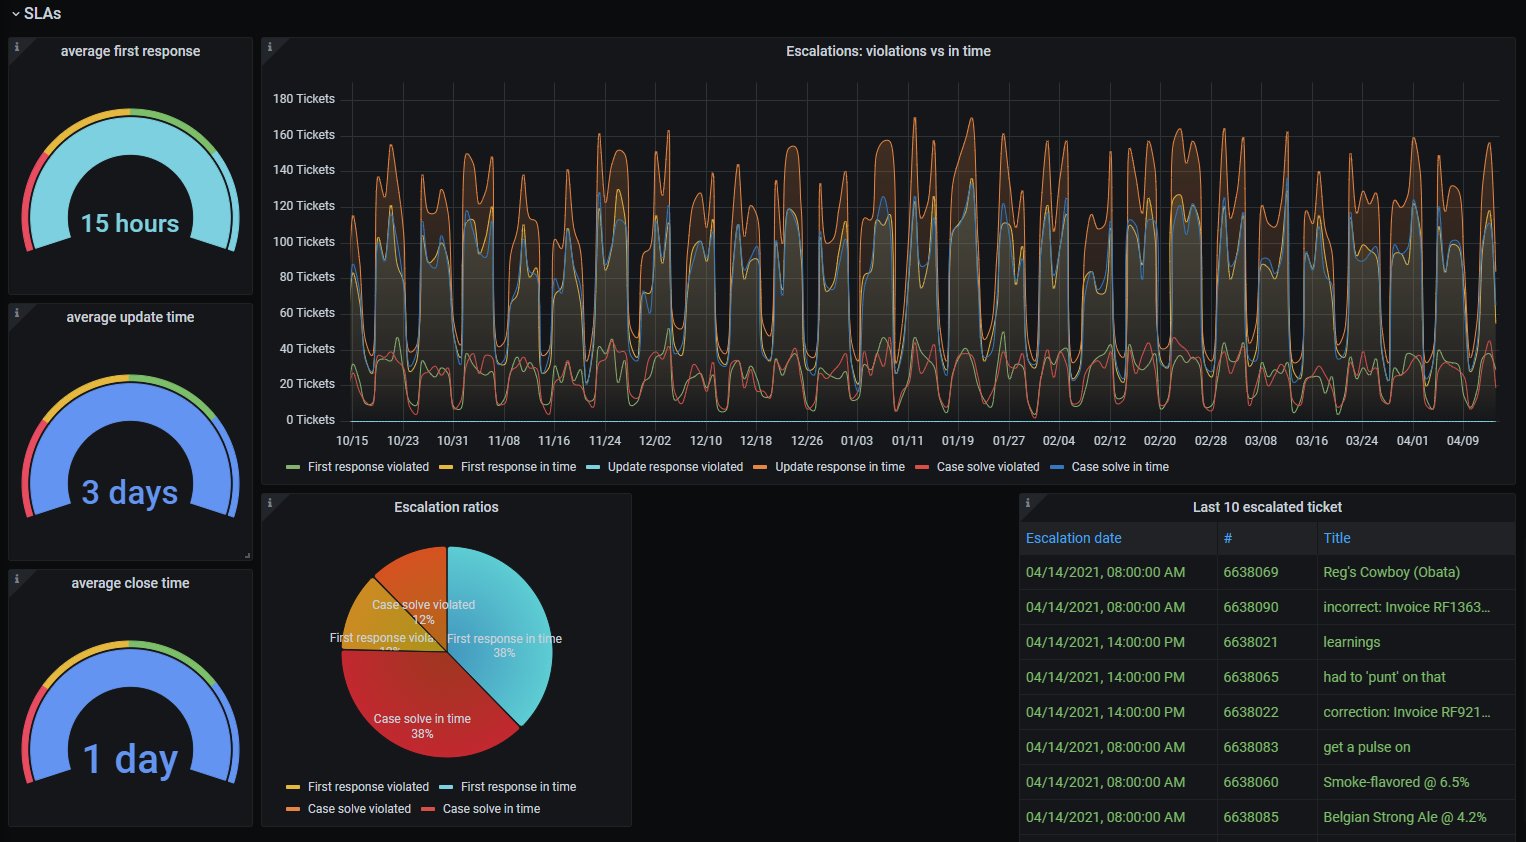
Dashboard Graphs
Ticket and Article Meta Information
- ticket group distribution
- sender ratio (e.g. Customer / Agent)[3]
- article type ratio (e.g. email, phone)[3]
- article content type
- escalation ratios[1]
- average first response, update time and close time[2]
- top 10 of:
- last 10 escalated tickets
Required Data Sources
ES - Ticket ArticlesES - Tickets by created_atES - Tickets by closed_at
Chat-Session Statistics Dashboard 14224
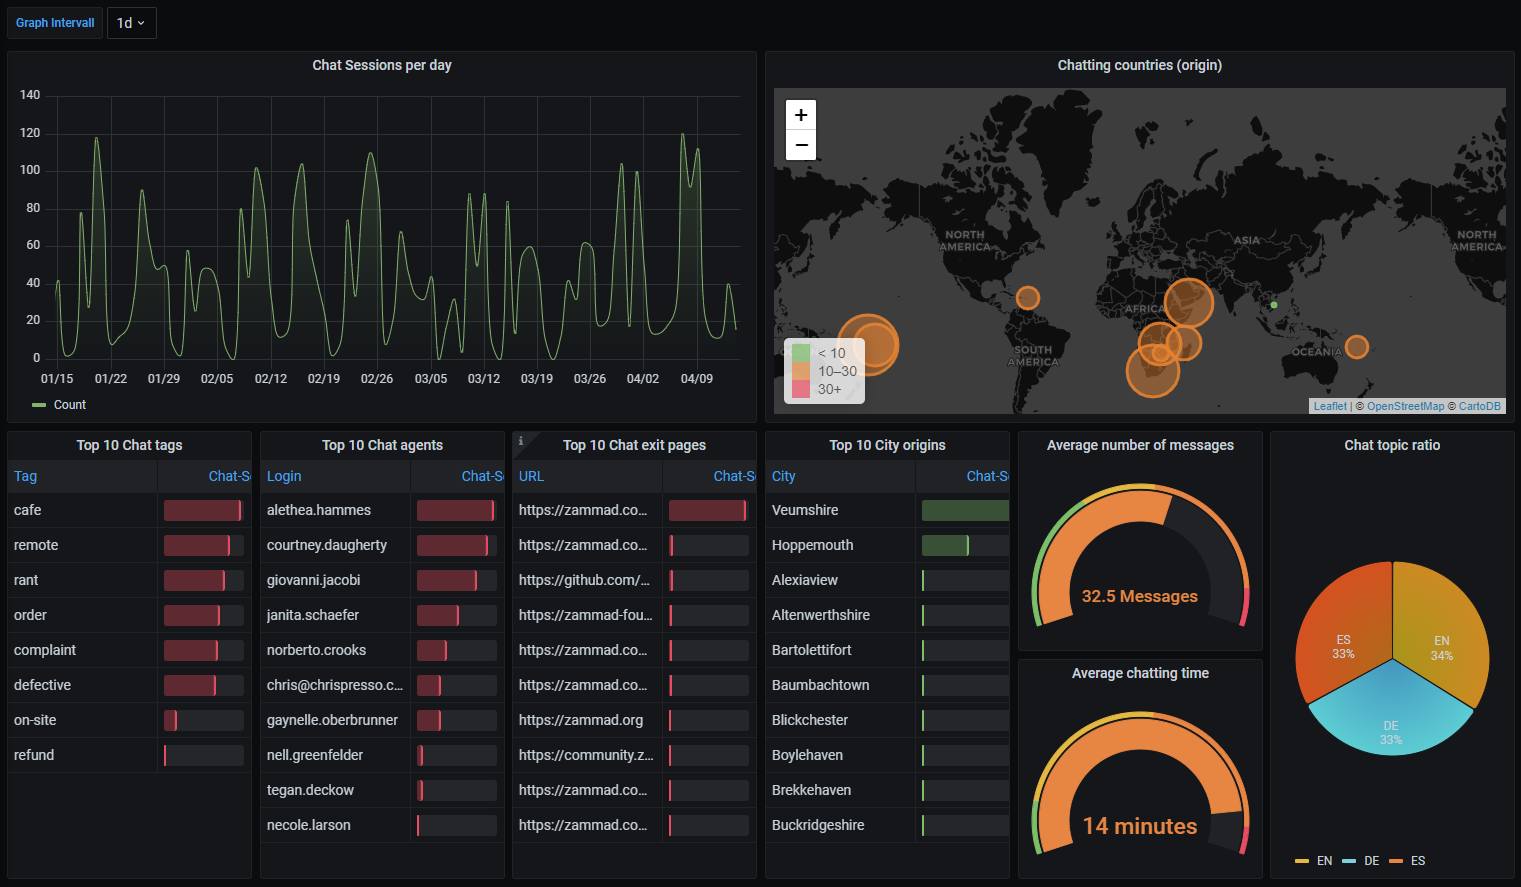
Dashboard Graphs
Chat session creations.
Chat Session Meta Information
- top 10 of:
- chat tags
- chat agents
- chat exit pages
- city origins
- chat topic ratio
- average number of messages within chat-sessions
- average chatting time
- world map with chat origin countries
Required Data Sources
ES - Chat Sessions
CTI-Log Statistics Dashboard 14223
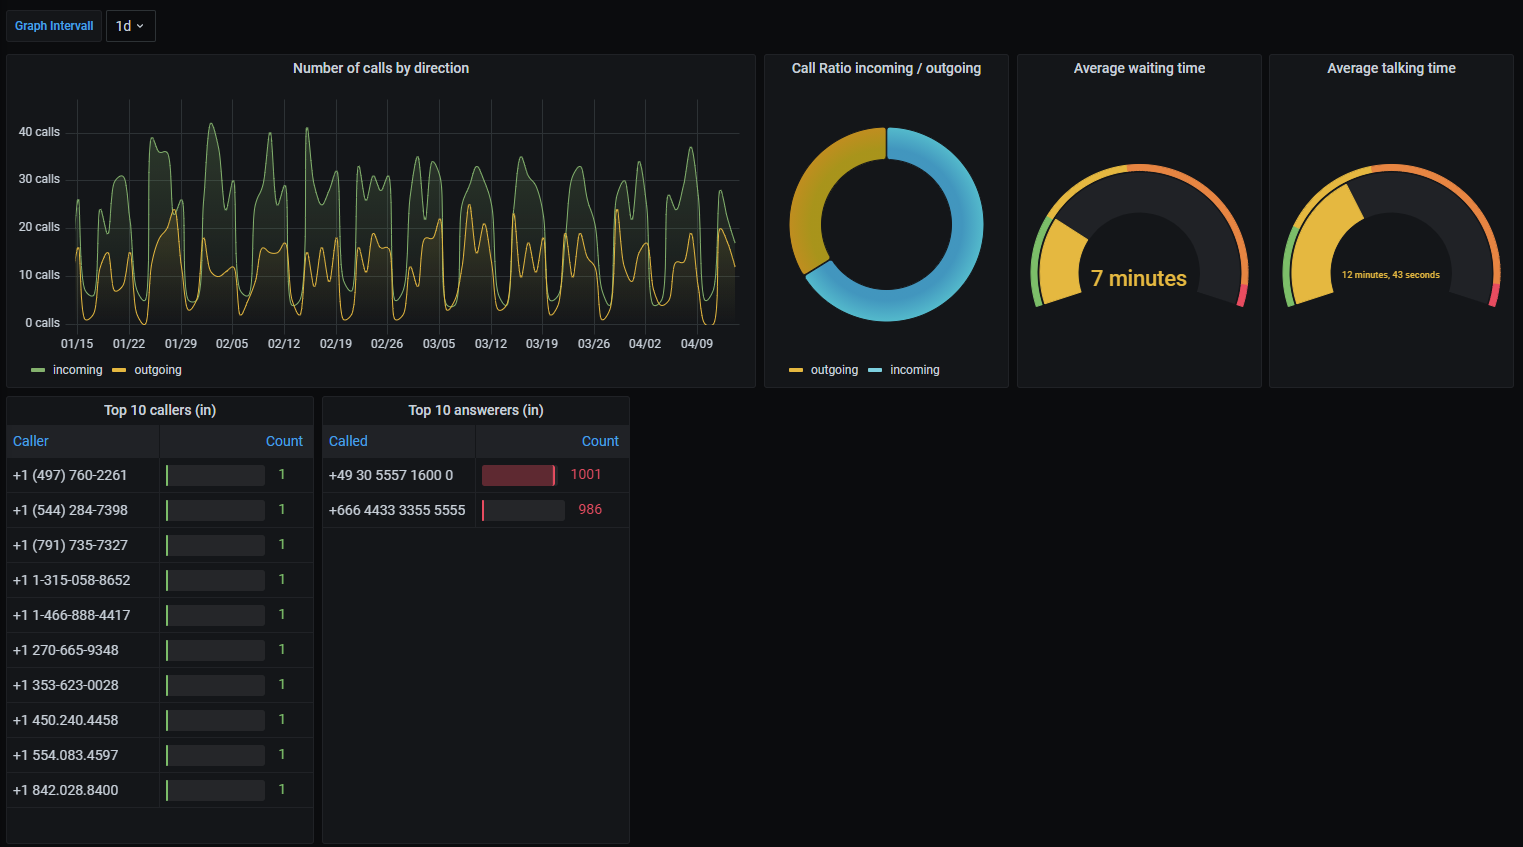
Dashboard Graphs
Number of calls per direction (in / out).
Chat Session Meta Information
- call ratio (in / out)
- average waiting time
- average talking time
- top 10 of:
- callers (in)
- call answerers (in)
Required Data Sources
ES - CTI Log
Some values are not available as time series information. This means we can only display the last value of the field in question. ↩︎ ↩︎ ↩︎ ↩︎ ↩︎ ↩︎ ↩︎
Requires SLA function to be active. Negative values indicate SLA violations. ↩︎ ↩︎
Specific reference IDs are not the same on every instance and thus the panel may not work or show incorrect data. Check the panels description on how to find our the relations on your system. ↩︎ ↩︎